The S-curve graph It's a great tool for tracking a project's progress, if we know how to use it.
A project can be an idea, an activity, a plan, an investment, or even a construction project, but in short, it always involves a series of steps, or actions, that, when completed, lead to the achievement of a fairly clear goal. Project planning is a key factor in a project's success, as is monitoring its progress and objectives.
When these objectives (and, therefore, the project) are complex, a methodology is needed to track progress toward the final milestone—that is, to determine whether the steps have been completed and how they were completed. For this purpose, there are tools that clearly show the progress of a project. One of the most commonly used is the “S-Curve” or “Advance Curve”, a tool that will allow us to monitor, track, and evaluate the progress of our project so that we can make adjustments wherever and whenever necessary.
What is an S-curve?
In terms of project management, a S-curve is a mathematical graph which represents relevant cumulative data for a project, such as cost or hours worked, in relation to time.
It is a curve plotted on the well-known Cartesian diagram, In fact, it gets its name from the shape it usually takes when a graph is plotted as a function of the time (x) and the cost (y) of the project. Generally, a project starts at zero cost and gradually increases over time; during intermediate phases, the growth is more rapid, before finally returning to a growth pattern similar to that of the initial phases.
This does not mean that all projects are carried out in the same way, since it is a tool used in all types of projects, It may be the case that a project is launched with a significant investment, as is often the case in the real estate sector, since the first step is to purchase the land to be developed.
The first version of the S-curve is created based on the schedule in effect at the start of the project and the initial budget. It can then be updated as new versions are created during the course of the project.
Why is it an «S»?
The S-curve It often takes this form because the Growth of the project tends to be slow in the early stages: It has just gotten underway; team members are researching the sector or are simply beginning to participate in the first phase of implementation, which may take longer at first, until they become familiar with it or until there are issues to resolve.
Then, as you go further, the Growth is accelerating rapidly, creating that upward slope that forms the the middle part of the «S.». This point of maximum growth It's called a inflection. During this period, project team members are working intensively on the project, and many of the major costs are incurred. After the inflection point, the growth is beginning to stabilize, forming the upper part of the «S,» known as the upper asymptote, and the «mature» phase of the project. This is because the project is almost complete and nearing completion: generally, at this stage, only tasks such as final touches and approvals remain.
.jpg)
S-Curve: Source: Envato
How do you create an S-curve?
Before plotting an S-curve, it is very important to ensure that the following information is available:
- Documentation and Overview of the entire project, that is, the rationale, possible constraints, projections, etc.
- A specific definition of the project's scope, its details, and any criteria for its acceptance.
- Identification of each element that make up the project, especially those that consume resources.
- An estimate of the time the period during which the project will be carried out and the costs required to implement it.
Once all this information has been gathered, it is very easy to plot the S-curve: Simply plot, on a Cartesian diagram, a cost value for each time value. Of course, the unit we assign to each one will depend on the needs of our project and what we want to highlight in the graph. In other words, time will be measured in days, months, or years, depending on the project's duration, and the cost will depend on the resource consumed—for example, a coin, or man-hours.
How to Use the S-Curve?
It may seem very simple, but knowing how to use an S-curve graph correctly will allow us to convey the information that truly matters to us in a concrete and precise way. After all, the very purpose of this tool is to inform stakeholders about the project progress on a regular basis, and it is necessary that it be simple and clear, to make decisions quickly.
The best way to use the S-curve graph is always to compare the projected progress, or the project's planned schedule, with the real progress of the project. This means that we must always first plot the project curve according to the plan, and during periodic reviews, plot the actual progress of the project; this way, we can clearly identify any deviations—whether beneficial or detrimental—from the project plan.
On the other hand, the S-curve serves as the basis for applying the management methodology of earned value, and determine delays or early payments on schedule and within budget, as well as identify trends and forecast completion dates and costs.
Example:
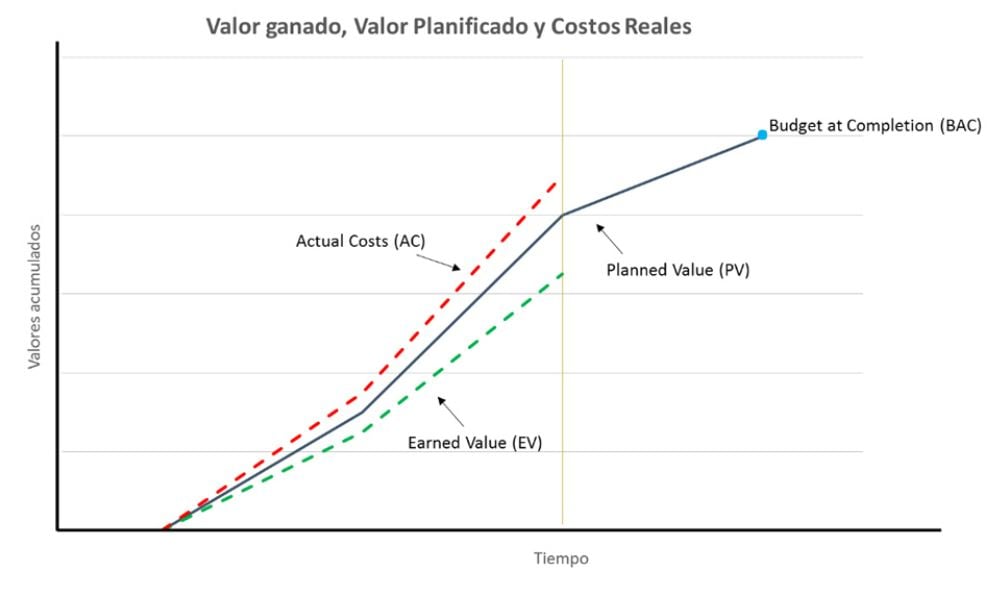
Example of the S-curve: Source: Sinnapsis
Given the importance of using these management tools, Structuralia It offers a significant amount of educational material in this field, as well as a variety of master's degree programs, such as: Master's Degree in Agile Methodologies and Digital Transformation, Master's Degree (MBA) in Business Administration and Management of Engineering and Construction Projects among many others.
Share this with your contacts!