
Some of the characteristics of a soil can be identified based on the size of its particles, by applying a particle size analysis.
Before installing anything on any type of floor, it is It is essential to know what type of soil we will be working with., since the characteristics and properties of the soil will inevitably affect the stability of the structure or building. This is determined through various geotechnical studies, some of which are conducted in a laboratory, such as particle size analysis, and other on-site events.
Also known as particle size analysis, granulometric analysis is one of the most basic tests used to to characterize a specific soil type, which makes it one of the most widely used, since it provides a very good approximation of soil characteristics; for example, its load-bearing capacity, his deformability, or its permeability.
This type of study aims to identify the sizes of the grains and particles that make up the soil, by obtaining a representative sample of it. There are two types of essays commonly used for this purpose, particle size distribution by sieving for particles ranging from 125 mm to 0.075 mm, and particle size analysis by sedimentation (using a hygrometer) for particles smaller than 0.075 mm
Particle Size Analysis by Sieving
For this analysis, a dry, broken-up, and weighed sample is passed through different sieves arranged from largest to smallest mesh size, shaking them to allow the sample to pass through. This process makes it possible to determine the percentage of material retained by each sieve, in order to create a particle size distribution curve.
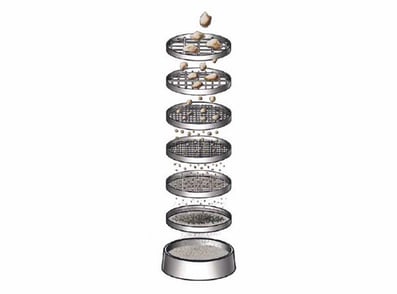 Sieve example. Source: dynapac
Particle Size Analysis by Sedimentation
It is carried out primarily in fine sand, silt, and clay. The study is based on the “law on Stoke”, which It relates the sedimentation rate of a particle within a fluid to the size of that particle. The test is performed by placing a sample in distilled water inside a sedimentation cylinder; a dispersant is added to prevent flocculation, and finally, the hydrometer is placed inside the container with the sample.
Graphical representation of a particle size analysis
The most common way to graphically represent the grain size distribution of a soil is through a semilogarithmic chart, where particle sizes are plotted on the X-axis (on a base-10 logarithmic scale), and on the Y-axis, an arithmetic scale from 0 to 100 %. This type of graph is intended to clearly illustrate the number of particles passing through each sieve, and it is called particle size distribution curve.
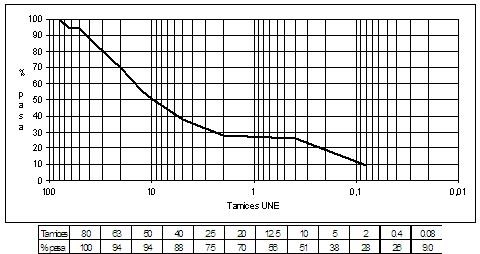 Example of a particle size distribution curve. Source: geotecniaymecanicasuelosabc
Information obtained through a particle size analysis
When conducting a particle size analysis in the field, the primary goal is to obtain the following data:
-
- Soil Impermeability: These are typically very fine-grained soils with pores that are too small to allow water to pass through, yet they do allow water vapor to pass through slowly by capillary action.
- The Distribution of Particle Types: The graph mentioned above shows the frequency with which certain types of particles occur in the soil, allowing us to determine which ones are more prevalent than others.
- The effective diameter of the soil: This is the particle size for which 10 % of that material is smaller, and it corresponds to the 10 % point on the particle size distribution curve, so that 10 % of the particles are finer than the effective diameter, and 90 % are coarser.
Without a doubt, particle size analysis is one of the most accessible tools for geotechnical engineers, serving as a simple yet effective first step toward understanding the characteristics of a soil. To learn about different types of studies and delve deeper into the world of geotechnical engineering, we recommend the International Master's Degree in Geotechnical Engineering and Foundations.