
Originally published on July 3, 2020; updated on February 17, 2023
The PERT Chart It is a project planning technique that falls under the category of network diagrams. It allows the entire team to manage time and resources more efficiently through this mechanism.
Find out what a PERT chart is and how to use it to benefit your project
Everyone wants to make sure their project be successful; however, not everyone is familiar with the tools to make it possible.
The graphical representation of the PERT Chart It is a set of points (nodes) connected by arrows. In this graph, the arrows represent the project tasks, while the nodes—which can be circular or rectangular—represent milestones in the project.
But what does PERT stand for, and where does it come from? The method Program Evaluation and Review Technique (PERT), or Program Review and Evaluation Technique, was developed by the U.S. Navy's Office of Special Projects in collaboration with Booz, Allen, and Hamilton.
PERT Chart: A network diagram
The PERT chart is a technique for project planning which falls under the category of network diagrams. It is a highly sophisticated method used to analyze each task required to complete a project. PERT diagrams, designed to large-scale projects, are used to identify the time needed to complete each task by calculating the shortest, longest, and most likely time estimates.
PERT charts make it possible to make informed decisions about task sequences, deadlines, and more, by providing a clear, visual understanding of time requirements of a project and interdependencies between tasks. Using this comprehensive map of your tasks and deadlines makes it easier for you and your team to complete the project in less time, with less waste and confusion, leading to better results for your team and your clients.
To design a PERT chart—as with other network diagrams—it requires more effort and more detailed information about the resources needed to complete each task and the factors that may affect them than other types of diagrams.
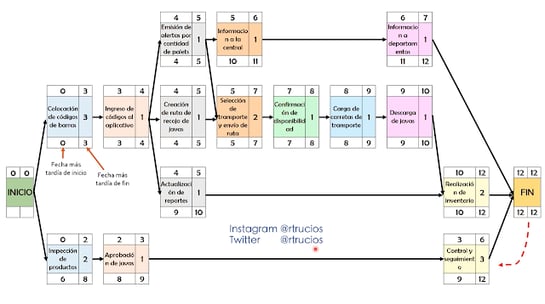 Example of a PERT Chart. Source: rafaeltrucios.blogspot.com
The Process of Designing a PERT Chart
If your goal is create a PERT chart You need to know these steps:
-
-
Divide the project into activities or tasks, defined as independent, homogeneous groups of work
- Estimate the most optimistic, most pessimistic, and most likely duration for each task
- Calculate the expected duration of each activity
- Create a list of activities ordered by priority, numbering the start and end nodes of each activity in ascending order as the project progresses. The node on the left of a task indicates its start, and the node on the right indicates its end.
- Draw the diagram by labeling the nodes of the network with their sequence numbers and the bars with the names of the activities.
-
The project duration will be a probabilistic value, and it will also be possible to determine the probability of completion within a given timeframe.
-
The PERT Formula and When to Use It
In order to estimate the appropriate duration of a project, those who have worked with PERT charts rely on at least the following four characteristics.
-
-
Optimistic time estimate (O): the shortest possible amount of time needed to complete a task.
- Calculation of the most probable time (M): an informed estimate of how long it will take to complete a task without any problems or delays.
- Pessimistic time estimate (P): the maximum amount of time needed to complete a task.
-
Expected time (E): a reasonable estimate of how long it will take to complete a task, taking into account potential problems and possible delays.
-
The basic PERT calculation equation used to determine the expected time is:
E = (O + 4M + P)/6
Once you have identified each time estimate, you can enter them into the PERT formula to calculate the duration of a project more efficiently.
Example: Let's show how this works using a simple home renovation as an example. If your optimistic time estimate is 160 days, your pessimistic estimate is 365 days, and your most likely estimate is 250 days, your equation will look like this:
E = (160 + 4 × 200 + 365)/6
Therefore, you can estimate that your home renovation will be completed in approximately 221 days.
Why should I use a PERT chart?
-
-
It requires detailed planning.
- It provides a tool for monitoring the program's status.
- They are not based on a single estimate of the duration of activities or tasks.
- It allows you to clarify time constraints for your team.
- It provides a detailed overview of the order in which the tasks should be performed.
- It helps the entire team manage time and resources more efficiently.
-
It reduces waste and costs during project development.
-
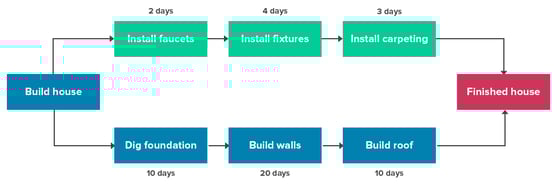 PERT chart. Source: www.workamajig.com
How do you interpret a PERT chart?
At the bottom of a PERT chart, there is a row of boxes that represent each task with two values: on the right, the first estimated planning date and to the left the latest completion date. The first cell tells us the earliest time the task can begin, taking into account its dependencies on previous tasks. The second cell shows the latest estimated time at which the task can begin without compromising the minimum project duration.
If the two dates are the same, we can conclude that there is no time difference between them. This means that There is no leeway in the task; in other words, the task must begin on the first day so as not to extend the project's completion deadline.
Ideally, the later date should be later than the earlier one; this way, the task can be delayed without compromising the project. This is what is known as the task margin, and this is calculated as the difference between the two values.
This note is quite useful because it shows us how much leeway we have to move the task along the timeline. It is important adjust all estimated deadlines implementation dates, resource availability, schedule, etc.
PERT Chart vs. CPM Chart
The Critical Path Method (CPM), or the critical path method, was developed in the United States by DuPont in collaboration with Remington Rand's UNIVAC Division. It is similar to a PERT chart, but the Task duration is considered a deterministic variable rather than a random one as in the previous one. The goal was to control completion times and, consequently, the associated costs. Interestingly, it was created a year before the PERT method (1958). Both can be effective tools for project planning and can increase project efficiency.
The main difference between PERT and CPM The fact is that a PERT chart is generally used when it is necessary to determine the time needed to complete a project, whereas the CPM is used for predictable projects that occur frequently. To explain it further, PERT charts are a method for planning and managing time, whereas the CPM is used to control costs and time.
Advantages and Disadvantages of the PERT Chart
Among its advantages, is located:
-
They require the detailed definition of the tasks to be performed.
- They need the detailed description the resources needed for each task.
- Identify the interfaces between tasks.
- Allows you to reliable estimates regarding the project timeline.
- Allows you to perform ratings on progress.
-
Identify problems and identify any potential causes of delays at an early stage.
The disadvantages of the PERT chart are:
- A PERT chart requires concentration as well as a great deal of work, time, and extra resources.
- Does not have the flexibility to adapt to unforeseen changes.
- The experience management It will be key to its success. It cannot be assigned lightly.
-
Since the main benefit is achieving results by specific deadlines It is not always possible to communicate through this mechanism, the financial standing of a project.
In conclusion, we can say that the PERT Chart is a method for the sophisticated project planning and something else complex than other types of diagrams. It shares some similarities with the CPM diagram, but focuses more on the relationships between tasks than on completion times.